
For automotive sales, marketing & service teams
Drop your Excel. Get your dashboard.
Stop stitching Excel exports from your DMS, CRM, call centre and ad platforms. Drop them into a single folder and our AI agent builds the automotive dashboards your managers ask for — then reshapes them on request, in plain language.
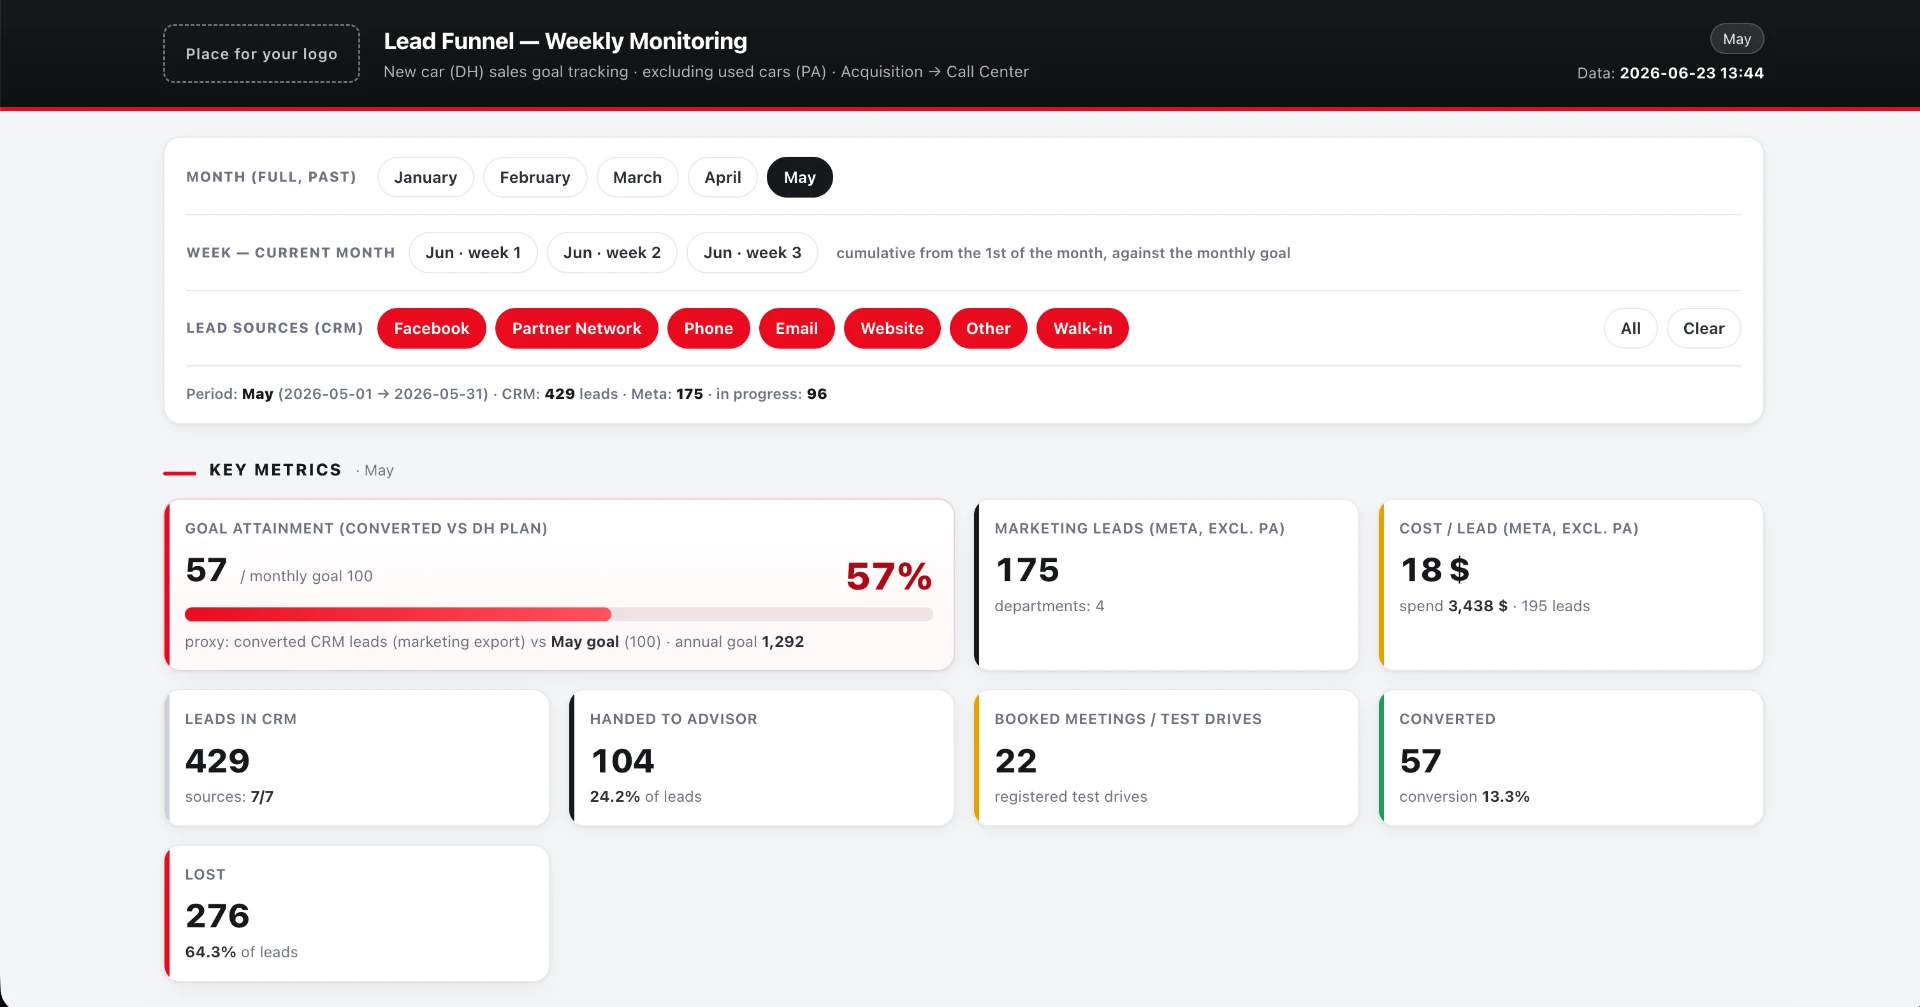
Dedicated dashboards in 1–2 days
Or take control — build your own with our AI Agent.
Single Source of Truth
from your data — sales, marketing and service numbers that finally match
0 BI licences
managers change views by typing, not by ticketing IT
How it works — three steps, no data project
Step 1
Drop your files in one folder
Weekly exports from your DMS, CRM, call centre, ad platforms and finance — the same Excel and CSV files your team already produces. No integration project, no IT queue.
Step 2
The AI maps and models them
It recognises columns, matches dealers, models and campaigns across systems, cleans duplicates and builds one consistent data layer behind the scenes.
Step 3
Ask for the dashboard you want
“Show test drives per dealer vs last quarter, split by campaign.” Type it, get it. Rename, re-chart and re-slice everything in plain language.
Step 4 — optional
Take full control — ask for an AI Agent and build any dashboard you want
Want more than a ready-made solution? Upgrade to our AI Agent implementation and create dashboards on your own terms — no coding, no waiting, no limits. Just describe what you need in plain language and watch it come to life.
- “Show me monthly revenue by region with a trend line for the last 12 months.”
- “Compare sales performance across teams — highlight the top 3.”
- “Give me a daily ops summary pulling from all three sheets.”
The AI Agent understands your data, builds the views you ask for, and lets you iterate in real time. You stay in control of every report, every insight, every decision.
This is reporting — on your terms.
Why teams keep it after the pilot
Working demo in days, not quarters
The platform already exists. We connect your folder, load your last few months of reports and hand you a live environment inside the first week.
Your data stays yours
Deployed on AWS in your own cloud account or ours, with role-based access per brand, dealer group and department. Built by a certified AWS, Snowflake and Databricks partner.
No BI licences to learn
Nobody writes DAX or SQL. Managers change their own views, and the numbers stay identical for everyone in the meeting.
Built for the people chasing the numbers
Sales managers
Volume, margin and stock ageing per dealer, model and salesperson — refreshed from the same exports you get today, without the Monday copy-paste.
Marketing managers
Spend, leads and cost per test drive across Google, Meta and portals, joined to what actually got sold and registered.
Customer service managers
Service load, response times, NPS and complaint themes per location, with the drill-down you currently rebuild by hand.
Proof of concept
See the proof of concept we built for a client
A dealer group dropped 14 recurring Excel reports from four systems into one folder. Within a week they had a single sales and marketing cockpit: volumes per dealer, lead-to-delivery conversion, campaign cost per test drive and service load — all refreshed from the same exports, all editable by typing a request.
- 14 recurring reports, 4 source systems, 1 folder
- Manual weekly consolidation dropped from ~2 days to minutes
- Same numbers for sales, marketing and customer service reviews
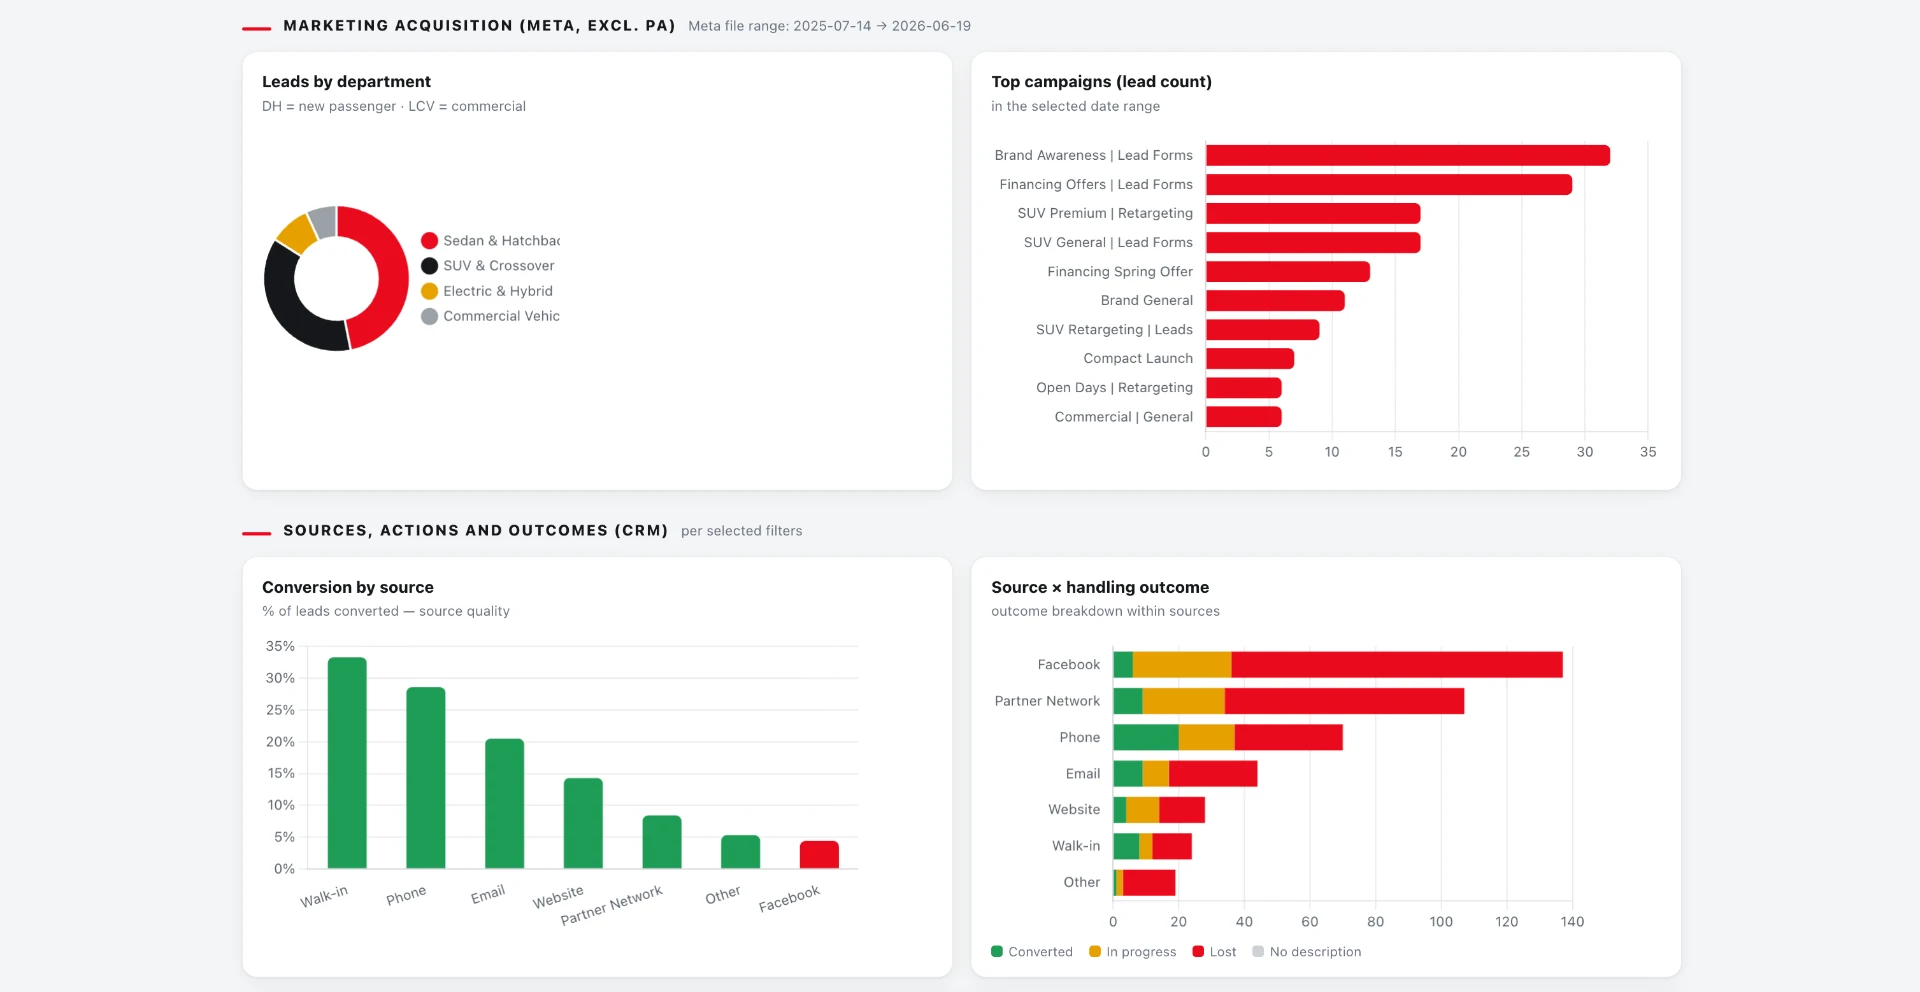
Book a demo
Tell us which reports hurt the most. We'll show the working tool on data that looks like yours, then agree what a demo environment for your company would contain — usually live within days.
Prefer to see the client proof of concept first? Mention it in the form and we'll open the session with it.